Sensex Gain 260 Points, Nifty at 24,620; Tomorrow Nifty Prediction

Indian Stock Market Wrap-Up: Benchmarks Close with Gains — All Eyes on RBI Decision on June 7
Indian equity markets posted modest gains on Tuesday, June 4, after a highly volatile trading session. Despite global uncertainty and mixed sectoral cues, both the Sensex and Nifty 50 managed to end the day in the green, indicating cautious optimism among investors.
The market movement came on the back of mixed global cues and investor positioning ahead of the Reserve Bank of India’s monetary policy meeting scheduled for Friday, June 7.
The formation of a bullish candlestick pattern on the daily charts further raised hopes of a potential trend reversal, boosting sentiment on Dalal Street.
Benchmark Performance
At the close of trade:
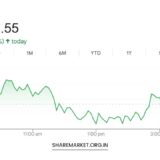
- BSE Sensex rose 260.74 points or 0.32%, ending the day at 80,998.25
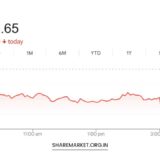
- NSE Nifty 50 gained 77.70 points or 0.32%, closing at 24,620.20
The session saw a total of 2017 stocks advancing, while 1835 declined, and 141 remained unchanged, reflecting a broadly positive yet selective market undertone.
Broader indices outperformed slightly, with the BSE Midcap and Smallcap indices ending 0.5% higher, signaling continued interest in non-large-cap segments.
Top Gainers and Losers – Nifty 50
Top Gainers:
- Eternal, Jio Financial Services, Bharti Airtel, IndusInd Bank, and Reliance Industries emerged as the biggest gainers on the Nifty index, driven by strong volume interest and positive outlooks in telecom and banking.
Top Losers:
- On the flip side, Trent, Bajaj Finserv, Shriram Finance, TCS, and Axis Bank dragged the index down with notable declines. Profit booking and sector rotation were evident in the pressure on finance and IT names.
Sectoral Performance
Sector-wise, performance was mixed, reflecting a lack of strong directional momentum:
- Gainers:
- Telecom, Metal, and Oil & Gas indices recorded gains in the range of 0.5% to 1%, benefiting from improving commodity prices and optimistic subscriber growth expectations in telecom.
- Loser:
- The BSE Realty Index was the major laggard of the day, slipping 0.7% amid concerns over interest rate outlook and rising input costs, which could impact margins for real estate companies.
Technical Analysis: Signs of a Potential Reversal
On the technical front, the Nifty 50 has formed a Bullish Harami candlestick pattern on the daily chart.
This is a classic reversal formation that signals a possible end to the current downtrend and the beginning of an uptrend, provided it is confirmed by follow-up bullish price action.
According to Aditya Gaggar, Director at Progressive Shares:
“The Bullish Harami pattern is a significant development. It suggests a pause in bearish sentiment and a potential pivot toward upward momentum. Support for the index lies firmly at 24,500, while the next key resistance is seen at 24,725. A breakout above this level could open the door to 24,900 and beyond.”
However, market experts caution that confirmation of the reversal will be key. Without sustained buying above resistance levels, the pattern may fail to materialize into a full trend shift.
Momentum Indicators: A Mixed Picture
Despite the bullish candlestick pattern, momentum indicators are sending conflicting signals:
- Rupak Dey, Senior Technical Analyst at LKP Securities, highlighted:
“A bearish crossover in the Relative Strength Index (RSI) suggests underlying weakness. Although the market has recovered, it’s still trading in a relatively narrow range. The RSI, a key momentum oscillator, is failing to show strong bullish divergence, which indicates that upward momentum is fragile.”
He further added that volatility is expected to persist in the near term, especially in the run-up to the RBI’s policy decision on Friday. In his view, 24,500 remains a critical support, and any breakdown below this level could accelerate the correction phase.
Market Sentiment: RBI Policy Takes Center Stage
Investor focus has now shifted squarely to the RBI’s upcoming monetary policy announcement on June 7.
Market participants widely expect the central bank to maintain the status quo on interest rates, but the accompanying commentary on inflation, GDP outlook, and liquidity management will be closely watched.
While inflation has eased from recent highs, uncertainty over food prices, monsoon conditions, and global crude oil volatility could influence the RBI’s tone. Traders are also looking for clarity on the central bank’s roadmap for achieving sustainable growth while managing inflation expectations.
Until then, short-term market movements are likely to remain range-bound, with volatility spikes on data or policy headlines.
Investor Strategy: What to Watch for June 5
Given the current technical and macro backdrop, here’s what investors and traders should monitor heading into the June 5 session:
- Confirmation of the Bullish Harami pattern with a close above 24,725
- Support hold at 24,500 – this is a make-or-break level for short-term sentiment
- Stock-specific opportunities in outperforming sectors like telecom, energy, and midcaps
- Global market cues, particularly from the US and China, which have shown mixed trends recently
- Developments related to monsoon progress and their potential impact on inflation-sensitive sectors like FMCG and auto
Final Thoughts
June 4’s market action reflects cautious optimism among investors amid technical support and a favorable sectoral tilt.
However, the broader direction remains tethered to macroeconomic signals, particularly the RBI’s upcoming policy stance.
While technical charts suggest a potential reversal, confirmation through price action and volume is essential.
Until then, markets may continue to trade in a limited range, with increased sensitivity to policy commentary and global trends.
As always, traders should maintain appropriate risk management and stay alert to evolving developments.