Analyzing Market Outlook: Bank Nifty Pullback Rally and August 28 Prospects

Market Outlook
Navigating Market Dynamics: Unraveling Bank Nifty’s Pullback Rally and Anticipating August 28 Movements
In the vast expanse of the financial markets, every trading day paints a new canvas of opportunities, challenges, and narratives. From the ebullient highs to the sobering lows, investors and traders constantly seek to decipher the intricate patterns that govern market behavior.
The recent market developments, including the Bank Nifty’s pullback rally and the market’s performance on August 25, have ignited discussions and speculations about the market’s future course.
In this comprehensive article, we delve deep into the dynamics that have shaped the recent market landscape, analyze the implications of the Bank Nifty’s rally, dissect the August 25 market performance, and project potential scenarios for the forthcoming August 28 trading session.
Bank Nifty’s Pullback Rally: A Short-Lived Triumph
The Bank Nifty, often regarded as a barometer of market sentiment due to its considerable impact on overall market trends, embarked on a pullback rally that caught the attention of investors and analysts alike.
This rally, however, met its match as it encountered resistance within the critical zone of 44900-45000. While the rally showcased moments of promise, the ultimate retreat signaled a tug of war between bullish and bearish forces in the market.
A significant aspect of this rally was the divergent signals emanating from both daily and hourly momentum indicators. These indicators, with their opposing trends, injected an air of uncertainty into the market.
Divergence is often interpreted as a precursor to a change in trend, prompting questions about the rally’s sustainability and the potential implications for the broader market.
Market Recap: August 25 and the Sea of Red
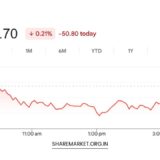
August 25 etched itself into the market’s chronicles as a day painted in hues of red. The Nifty, a bellwether index, experienced a downward slide, closing at approximately 19250.
This decline was attributed to selling pressures that permeated across various sectors. The Sensex, another pivotal index, mirrored this sentiment by concluding the trading session at 64886.51, registering a decline of 365.83 points, or 0.56%.
Echoing this trend, the Nifty ended its journey at 19265.80, marking a dip of 120.90 points, equivalent to a 0.62% loss.
The trading arena witnessed a blend of gainers and losers. Approximately 1446 shares managed to defy the downtrend, signaling pockets of optimism amid the sea of red. However, this optimism was met with a wave of pessimism as 2079 shares experienced a decline.
In the midst of this ebb and flow, 110 stocks maintained their equilibrium. The gainers’ brigade was led by Bajaj Finserv, Asian Paints, Bajaj Finance, ONGC, and Bharti Airtel. In contrast, Dr. Reddy’s Laboratories, Adani Ports, JSW Steel, Power Grid, and Larsen & Toubro emerged as the prominent losers of the day.
The market’s collective downturn was mirrored in the performance of sectoral indices. Notably, Capital Goods, FMCG, PSU Bank, Metal, Realty, and Power sectors witnessed a uniform decline of approximately 1% each.
This decline was not solely confined to heavyweight players; it permeated through to the realm of small and medium stocks.
The BSE Midcap index bore the brunt of this pressure, marking a decline of about 1%, while the Smallcap index registered a relatively milder dip of 0.2%.
Peering into the Crystal Ball: Prospects for August 28
With August 28 looming on the horizon, market enthusiasts and participants are eager to glean insights into the potential trajectories that await. Jatin Gedia, an analyst at Sharekhan, offers his perspective on the unfolding market drama.
The Nifty’s opening on August 25 with a gap down set the stage for a day characterized by volatility.
As the trading day concluded, it left in its wake a loss of 120 points. A glance at the daily chart elucidates the continuation of selling pressure that had gripped the market in the preceding sessions.
A broader view of the weekly chart paints a somber picture – the Nifty recorded a red close for the fifth consecutive week.
This consistent downward trajectory is further underscored by the negative crossovers witnessed in the weekly, daily, and hourly momentum indicators.
These crossovers, indicative of waning momentum, point towards an enduring sentiment of selling in the market.
Both the price and momentum indicators converge to depict a landscape characterized by enduring market weakness.
In light of these observations, the outlook for the Nifty remains shrouded in pessimism. Gedia contends that the Nifty might veer towards the 19100 mark in the upcoming trading sessions.
A robust support zone lies nestled between 19200 and 19180, while potential resistance emerges within the range of 19360-19400.
The banking sector, often a lynchpin of market dynamics, stands at a crucial juncture. Gedia delves into this realm, observing that the pullback rally in the Bank Nifty reached its zenith within the range of 44900-45000.
However, the rally’s momentum petered out within this zone. Adding a layer of complexity, the daily and hourly momentum indicators for the Bank Nifty offer divergent signals, casting an air of ambiguity over its trajectory.
This divergence, reflecting contrasting momentum trends, sets the stage for a potential consolidation phase within the range of 44800-43900.
Ajit Mishra, an expert at Religare Broking, lends his insights to the ongoing market saga. He notes that the market’s struggle persisted on August 25, with a decline of over 0.50%.
The day commenced with a gap-down opening for the Nifty, which continued its journey within a range-bound pattern throughout the trading session. The day culminated with the Nifty closing at its lowest point – 19265.80.
Among the sectoral indices, realty, pharma, and metal took the brunt of the losses. This sentiment trickled down to small and medium stocks as well, resulting in profit booking.
Ajit Mishra underlines a significant development – the breach of the crucial support level of the short-term moving average, represented by the 50-day Exponential Moving Average (EMA).
This breach is often construed as an indicator of impending market weakness. As the market landscape unfolds, the support level at 19100 emerges as a pivotal point of interest for market participants.
Concluding Thoughts
In the intricate tapestry of the financial markets, each trading day weaves a new narrative, revealing trends and insights that guide investors’ decisions. As the market concluded with a resounding note of red on August 25, attention pivots towards August 28.
The signals emanating from momentum indicators, the pullback rally, and sectoral performance serve as beacons of guidance.
Whether the market regains its stride or charts a new course, the insights gleaned from these dynamics offer valuable perspectives for investors and observers alike.
As the market landscape continues to evolve, the collective anticipation centers on how these intricacies will shape the market’s journey in the days to come.