Market Outlook: Nifty Closes Above 19800 – Insights into September 11 Market Movement
Market Outlook
Market Outlook: Positive Trends in Capital Goods, Oil and Gas, Power, and Realty; Pharma Index Dips by 0.3%
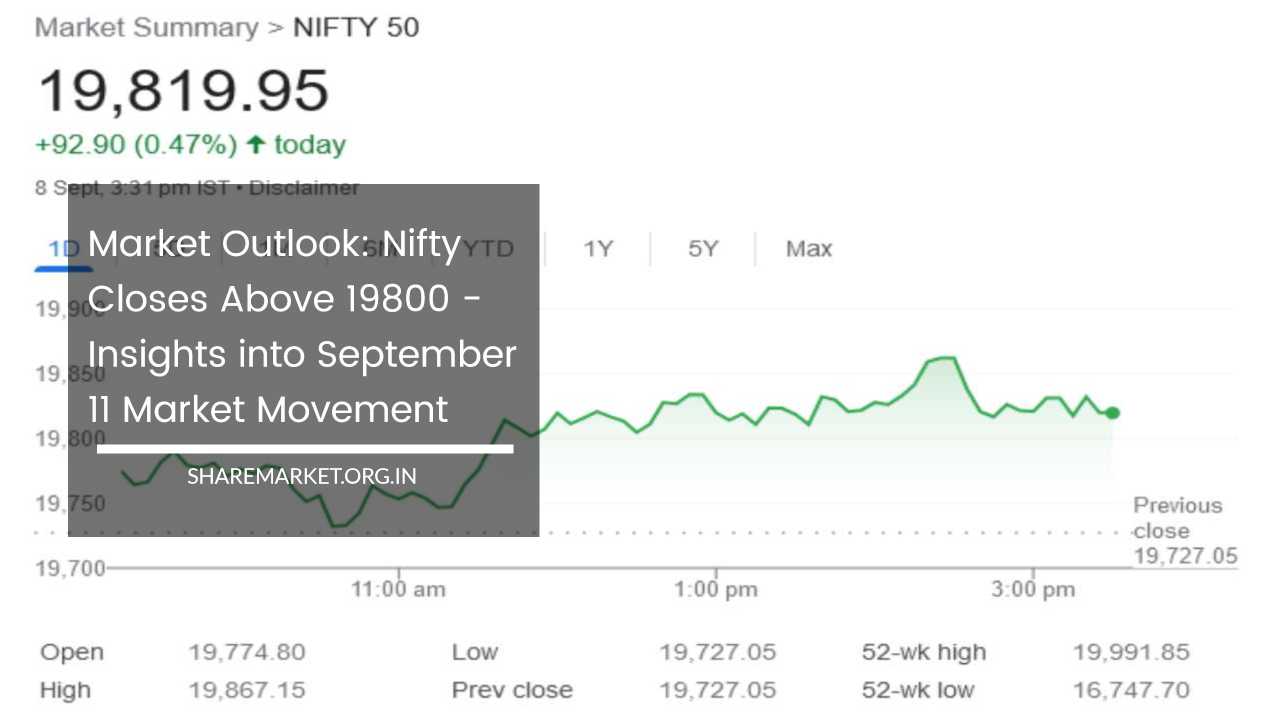
In today’s market update for September 8, the bullish momentum continued for the sixth consecutive day. Nifty successfully closed above the 19800 mark, while the Sensex concluded at 66598.91, securing a gain of 333.35 points, or 0.50 percent.
Nifty also saw a rise of 93 points or 0.47 percent, closing at 19,820. Among the stocks, 1959 recorded gains, 1611 saw declines, and 120 remained unchanged.
Top gainers on the Nifty included Coal India, NTPC, BPCL, Tata Motors, and Larsen & Toubro, while UPL, Eicher Motors, Apollo Hospitals, ITC, and UltraTech Cement were among the top Nifty losers.
Out of the 30 stocks in the Sensex, 21 experienced gains, while 31 out of the 50 Nifty stocks witnessed buying interest. Additionally, 11 out of the 12 shares comprising the Nifty Bank index recorded gains.
Breaking down sectoral indices, Capital Goods, Oil & Gas, Power, and Realty registered substantial gains of 1.5-2 percent, whereas the Pharma index experienced a minor dip of 0.3 percent.
Furthermore, the BSE Midcap index concluded with a gain of 0.9 percent, and the Smallcap index ended 0.4 percent higher.
On the currency front, the Indian rupee strengthened against the dollar, closing at 82.94 per dollar, marking a 27-paise gain from the previous day’s rate of 83.21.
Now, looking ahead to the market movement on September 11:
Amol Athawale of Kotak Securities notes that despite the weakness in Asian and European markets, the Sensex and Nifty have continued their winning streak, with investors increasingly turning their attention to India due to a lack of opportunities elsewhere. Investors are favoring companies that are likely to play a pivotal role in future economic growth.
Technically, Nifty is maintaining a higher bottom formation and is comfortably trading above the 50 and 20-day Simple Moving Averages (SMA), signaling a positive trend.
Additionally, a long bullish candlestick on the weekly chart suggests potential further upside from current levels.
For Nifty, the major support levels for trend-following traders are at 19700-19650. If this support holds, a move up to 19900 levels is conceivable, and potentially even up to 20000.
Conversely, a dip below 19650 could weaken the uptrend, possibly leading to a decline towards 19550-19500.
Bank Nifty has also crossed the 50-day SMA, which is a positive development, and it has formed a higher bottom formation, indicating potential for further upside. Positional traders should watch the support at 44700 or the 50-day SMA.
If this support holds, a rally in Bank Nifty up to 45600-45900 could be in the cards. Conversely, a move below 44700 might see Bank Nifty slipping towards the 20-day SMA or the 44300-44000 levels.
Jatin Gedia of Sharekhan adds that Nifty has started the day with gains and maintained its upward trajectory. The hourly chart indicates that Nifty has reached the upper end of a rising channel, suggesting a possible consolidation in the coming week within the range of 19850 – 19670.
While consolidation is expected, the presence of positive crossovers in daily and hourly momentum indicators indicates a bullish trend.
Thus, any dips during consolidation could present buying opportunities, with the potential for Nifty to reach the 19900 level next week, near the July swing high.
On the downside, support can be found at 19630 – 19670, while resistance is observed at 19860 – 19900.
In the case of Bank Nifty, buying interest persisted, even after breaking out of consolidation in the previous session. Positive crossovers in momentum indicators signal bullish sentiment, and the outlook for Bank Nifty appears favorable, with the possibility of reaching 45500 in the short term.”
Market Analysis and Outlook:
The Indian stock market has shown remarkable resilience and strength, as indicated by the positive performance observed on September 8.
The Nifty managed to sustain a winning streak that extended for six consecutive trading sessions, and this has not gone unnoticed by investors and analysts.
Let’s delve deeper into the market trends and factors that are shaping the outlook for the Indian stock market:
Sectoral Performance:
One of the notable aspects of the market’s performance on September 8 was the sectoral dynamics. Several sectors displayed significant gains, while others faced some challenges:
- Capital Goods: Capital Goods stocks experienced substantial growth, with gains ranging from 1.5 to 2 percent. This performance suggests optimism regarding infrastructure development and investment in the sector.
- Oil and Gas: The Oil and Gas sector also fared well, contributing to the overall positive sentiment. This could be attributed to factors such as rising crude oil prices and increased energy demand.
- Power: The Power sector joined the list of gainers, which may reflect renewed interest in the energy sector, driven by India’s expanding power generation and distribution capabilities.
- Realty: Realty stocks showed positive momentum, indicating confidence in the real estate market’s recovery. Factors like low-interest rates and government incentives for the housing sector might be influencing this trend.
- Pharma: On the flip side, the Pharma sector witnessed a slight decline of 0.3 percent. This could be attributed to various factors, including regulatory challenges and market dynamics specific to the pharmaceutical industry.
- Midcap and Smallcap Indices: Both the BSE Midcap and Smallcap indices posted gains, showcasing a broader market rally. This is often seen as a positive sign, as it indicates that the market’s upward movement is not limited to large-cap stocks.
Sensex and Nifty Performance:
The performance of the benchmark indices, Sensex and Nifty, is a key focus for market participants. On September 8, the Sensex closed at 66598.91, marking a gain of 333.35 points or 0.50 percent. Similarly, Nifty witnessed a rise of 93 points or 0.47 percent, closing at 19,820.
The fact that both indices closed in the green indicates overall positive sentiment in the market. It’s worth noting that these gains were achieved despite challenging global market conditions, including weakness in Asian and European markets. This suggests that investors are finding opportunities and confidence in the Indian market.
Market Breadth:
Market breadth, which measures the number of advancing and declining stocks, provides insights into the overall health of the market.
On September 8, out of the 30 stocks in the Sensex, 21 experienced gains, reflecting a relatively broad-based rally. Additionally, 31 out of the 50 Nifty stocks witnessed buying interest, further highlighting positive market breadth.
The fact that more stocks are on the rise than on the decline is a positive sign, as it suggests that the optimism is not limited to a handful of companies but is spread across various sectors and stocks.
Top Gainers and Losers:
Examining the top gainers and losers can provide insights into which stocks are driving the market’s movement.
On September 8, the top gainers on the Nifty included companies like Coal India, NTPC, BPCL, Tata Motors, and Larsen & Toubro. These companies likely contributed significantly to the Nifty’s positive performance.
Conversely, the top Nifty losers on that day included UPL, Eicher Motors, Apollo Hospitals, ITC, and UltraTech Cement.
Understanding the reasons behind these stocks’ movements can provide valuable insights into sector-specific dynamics and investor sentiment.
Nifty and Bank Nifty Technical Analysis:
Technical analysis is a valuable tool for understanding potential price movements in the market. Amol Athawale of Kotak Securities provides a technical perspective on Nifty and Bank Nifty:
- Nifty is maintaining a higher bottom formation, indicating an overall positive trend.
- It is trading comfortably above the 50 and 20-day Simple Moving Averages (SMA), reinforcing the bullish sentiment.
- A long bullish candlestick on the weekly chart suggests the possibility of further upside from current levels.
For Nifty, key support levels lie at 19700-19650. Maintaining this support could lead to a potential rally towards 19900, and even 20000. Conversely, a drop below 19650 might weaken the uptrend, potentially leading to a decline towards 19550-19500.
Bank Nifty also presents a positive outlook, with several technical factors favoring further upside:
- Bank Nifty has crossed the 50-day SMA, a significant development.
- It has formed a higher bottom formation, indicating the potential for additional gains.
For positional traders, the support level to watch is at 44700 or the 50-day SMA. If this support holds, a rally in Bank Nifty up to 45600-45900 could be in store.
On the downside, a move below 44700 might lead to a retracement towards the 20-day SMA or levels around 44300-44000.
Additional Insights from Jatin Gedia of Sharekhan:
Jatin Gedia provides further insights into the technical aspects of Nifty and Bank Nifty:
- Nifty’s hourly chart shows it has reached the upper end of a rising channel, suggesting a potential consolidation phase in the near future.
- Despite the expected consolidation, positive crossovers in daily and hourly momentum indicators signal a bullish trend.
- The consolidation range for Nifty is projected to be between 19850 and 19670.
- Investors should look for buying opportunities during any dips within this consolidation range.
- A possible target for Nifty in the upcoming week is the 19900 level, situated near the July swing high.
For Bank Nifty, the bullish sentiment remains intact:
- Buying interest in Bank Nifty has persisted even after breaking out of the recent consolidation phase.
- Positive crossovers in momentum indicators support a bullish outlook.
- A short-term target for Bank Nifty is projected at 45500.
Market Sentiment and Global Context:
Understanding market sentiment is crucial for investors and traders. Despite global uncertainties and challenges, the Indian stock market has continued to display resilience and attract investment. Several factors contribute to this positive sentiment:
- Global Factors: Weakness in Asian and European markets hasn’t deterred investors from seeking opportunities in India. This suggests that India is emerging as an attractive investment destination.
- Economic Growth: Investors are favoring companies that are expected to play a pivotal role in India’s economic growth. This indicates confidence in the country’s economic prospects.
- Technical Indicators: Positive technical indicators, such as higher bottom formations, bullish candlesticks, and SMA crossovers, reinforce the bullish sentiment.
- Market Breadth: The broad-based rally, as indicated by the positive performance of midcap and smallcap stocks, suggests a healthy and sustainable market trend.
Rupee’s Strength: Another noteworthy development is the strengthening of the Indian rupee against the dollar.
On September 8, the rupee closed at 82.94 per dollar, marking a 27-paise gain from the previous day’s rate of 83.21. A stronger rupee can have various implications, including reduced import costs and improved economic stability.
September 11 Market Outlook:
While past performance and technical analysis provide valuable insights, it’s essential to remember that the stock market is influenced by a multitude of factors, and predicting its exact future movements remains challenging.
However, the expert opinions and technical indicators shared by Amol Athawale and Jatin Gedia provide a reasonable basis for understanding potential scenarios for September 11:
- Positive Momentum: The market has displayed remarkable resilience and positive momentum, driven by factors such as investor interest, sectoral performance, and technical indicators.
- Consolidation: A period of consolidation within a specific range is anticipated for Nifty. Such consolidation phases are common after prolonged bullish runs and provide opportunities for investors to enter or exit positions.
- Sector-Specific Opportunities: Investors should pay attention to sectoral dynamics, as different sectors are exhibiting varying levels of strength. Capital Goods, Oil and Gas, Power, and Realty sectors have shown promise, while Pharma faces some headwinds.
- Support and Resistance Levels: Technical analysis suggests key support and resistance levels for Nifty and Bank Nifty. These levels can serve as reference points for traders and investors.
- Global and Economic Factors: Keep an eye on global developments and economic indicators that may impact the Indian market. Geopolitical events, economic data releases, and central bank policies can all influence market sentiment.
- Rupee-Dollar Exchange Rate: The exchange rate between the Indian rupee and the US dollar is a crucial factor, especially for businesses engaged in international trade. A stronger rupee can have positive implications for importers and the overall economy.
In conclusion, the Indian stock market continues to exhibit resilience and positive momentum, attracting both domestic and international investors.
While technical analysis provides valuable insights, market participants should remain vigilant, adapt to changing conditions, and consider a diversified approach to their investment strategies.
Additionally, staying informed about global developments and economic indicators is essential for making informed investment decisions.
Please note that investing in the stock market involves risks, and it is advisable to consult with a financial advisor or conduct thorough research before making investment decisions.
Market conditions can change rapidly, and past performance is not indicative of future results.