Nifty Closed at 21,853; Nifty Prediction for Tomorrow
Nifty Prediction for Tomorrow
In-Depth Analysis of Stock Market Trends and Future Outlook
The stock market, often a reflection of economic dynamics and investor sentiment, has been experiencing nuanced trends and signals, making it imperative for traders and investors to conduct a comprehensive analysis.
As of February 2nd, the juxtaposition of daily and hourly momentum indicators along with the contraction of Bollinger Bands has painted a picture of a market trapped within a tight range.
This analysis will delve deeper into the specific market movements on that day, the weekly performance, insights from market analysts, and the broader implications for traders and investors.
Daily Market Overview:
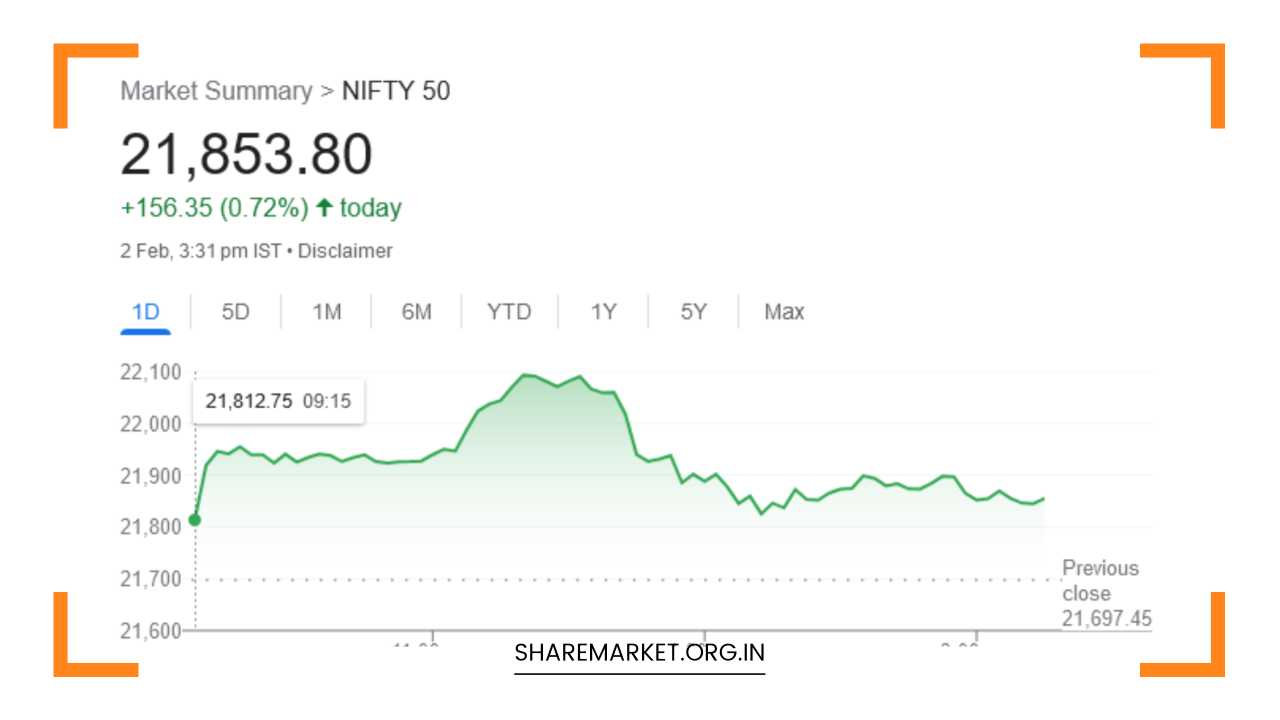
On February 2nd, a day marked by volatile trading, the benchmark indices closed with gains. Nifty was observed hovering around the 21,850 mark, while the Sensex closed at 72,085.63, registering an increase of 440.33 points or 0.61%.
Simultaneously, Nifty closed at 21,853.80, reflecting a gain of 156.30 points or 0.72%. Among the 3,295 actively traded stocks, 1,759 witnessed gains, 1,469 experienced declines, and 67 remained unchanged.
The BSE Midcap index demonstrated a noteworthy increase of 0.8%, while the Smallcap index exhibited a modest gain of 0.5%.
Top Nifty Gainers and Losers:
The daily performance was characterized by a mix of gainers and losers, showcasing the diversity within the market.
Notable gainers included BPCL, Power Grid Corporation, ONGC, Adani Ports, and NTPC. Conversely, Eicher Motors, Axis Bank, HDFC Life, HDFC Bank, and HUL found themselves among the top losers.
This divergence in individual stock performances underscores the complexity and multitude of factors influencing the market on any given day.
Sectoral Indices Performance:
A closer look at the sectoral indices revealed diverse performances. The Oil and Gas index stood out with a significant 4% increase, indicating robust performance in that sector.
On the other hand, the IT, Metal, Realty, and Power indices recorded more moderate gains ranging from 1% to 2%. However, the bank index experienced a marginal decline of 0.5%.
This sectoral divergence adds an additional layer of intricacy to market dynamics, indicating that certain sectors are driving the overall market sentiment.
Weekly Market Analysis:
Expanding the timeframe to a weekly perspective, the market displayed a notable shift in trend. Breaking a sequence of two consecutive weeks of weakness, the indices closed at a record weekly high, a feat not achieved in the past two months.
Despite this positive weekly performance, Sensex-Nifty recorded a 2% loss, reflecting the challenges faced earlier in the week. In contrast, Bank Nifty bucked the trend, posting a 2.4% increase.
The Nifty Midcap index, however, faced a decline of 2.6%. All sectoral indices, excluding the media sector, registered gains, with PSU Bank emerging as the top-performing index.
Market Analysts’ Insights:
Market analysts play a crucial role in deciphering market movements and providing insights for traders and investors.
Two analysts, Rupak Dey from LKP Securities and Jatin Gedia of Sharekhan, provided valuable perspectives on the potential trajectory of the market on February 5th.
Rupak Dey observed that Nifty breached the 22,000-mark during the initial half of Friday’s trading session but later formed a double top on the hourly charts.
According to Dey, a decisive breakout above the double top, positioned around 22,125, would be crucial to confirming the resumption of the bullish trend.
Conversely, breaching the support level of 21,500 might intensify the decline. A breakout above 22,150, according to Dey, would pave the way for Nifty to reach 22,500 and beyond.
Jatin Gedia of Sharekhan shared a similar sentiment, noting that Nifty opened with a rise, touching a new all-time high of 22,126.80.
However, a sharp selloff followed, pushing Nifty back into the wider range of 21,200 – 21,900. Gedia’s analysis suggested a complex and dynamic market scenario, reinforcing the idea that markets are influenced by a myriad of factors, often leading to unpredictable fluctuations.
Consolidation Signals:
One of the key takeaways from the current market scenario is the indication of a consolidation phase. The convergence of daily and hourly momentum indicators giving different signals, coupled with the contraction of Bollinger Bands, strongly suggests that Nifty is currently undergoing a consolidation phase.
This suggests that the market is grappling with a range-bound pattern, and the potential for significant directional movement remains uncertain.
Specifics on Consolidation:
In this environment of consolidation, market participants can expect stock-specific action and sector rotation to take center stage.
The intricacies of individual stocks and sectors may play a pivotal role in shaping the market dynamics during this phase.
Traders need to be nimble and adapt their strategies to the changing landscape, recognizing that a one-size-fits-all approach may not be effective in such conditions.
Support and Resistance Levels:
For Nifty, crucial support levels are identified at 21,660 – 21,600, while resistance is seen at 22,100 – 22,150. These levels serve as critical markers for traders and investors, influencing decision-making processes based on potential breakthroughs or breakdowns.
Understanding these levels is essential for risk management and strategic planning in the current market environment.
Bank Nifty Dynamics:
Within the banking sector, specific attention is drawn to the 46,900 – 47,000 zone, where selling pressure was noted.
This zone aligns with the 61.82% Fibonacci retracement level of the entire decline witnessed from 48,636 to 44,429.
The short-term outlook for Bank Nifty, as suggested by analysts, points toward a consolidation phase within the range of 47,000 – 45,500.
This information is crucial for traders focusing on the banking sector, as it provides a framework for anticipating potential price movements and making informed decisions.
Final Thoughts:
In conclusion, the stock market’s intricate dance of signals and indicators reflects the underlying complexity of the financial landscape.
The daily and weekly performance, insights from market analysts, and signals of consolidation all contribute to the comprehensive understanding of the market dynamics.
Traders and investors need to navigate this complexity with a nuanced and adaptive approach, recognizing that markets are influenced by a multitude of factors, both macroeconomic and microeconomic.
As the market undergoes a consolidation phase, the importance of stock-specific analysis and sector rotation cannot be overstated.
The support and resistance levels for key indices, such as Nifty, provide crucial reference points for strategic decision-making. Similarly, insights into Bank Nifty dynamics offer valuable information for those focusing on the banking sector.
In this ever-evolving market, adaptability and a thorough understanding of the broader economic landscape are essential.
Market participants should stay vigilant, continuously monitor indicators, and be prepared to adjust their strategies based on unfolding developments. In the complex world of finance, informed decision-making remains the cornerstone of successful trading and investing.