Nifty Fell and Closed Around 21,500; Nifty Prediction for Tomorrow
Nifty Prediction for Tomorrow
Market Analysis and Outlook: Navigating Volatility on January 30 and Anticipating Moves on January 31
The stock market’s performance on January 30 unfolded against a backdrop of heightened volatility, leaving traders and investors keenly observing the fluctuations in benchmark indices such as Nifty and Sensex.
In this comprehensive analysis, we delve into the intricate details of the market’s movements on January 30, with a specific focus on Nifty, and explore expert opinions regarding potential trajectories on January 31.
Market Snapshot on January 30:
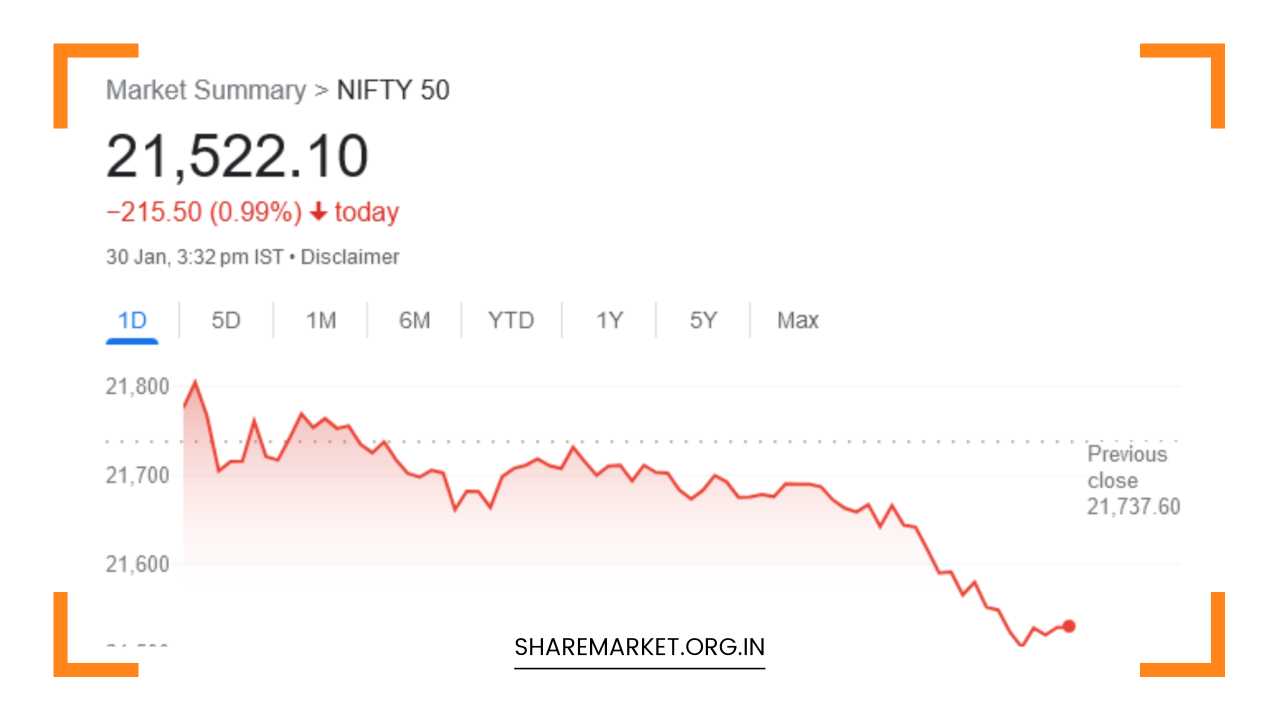
The trading session on January 30 showcased a tumultuous ride, particularly impacting the benchmark index Nifty, which witnessed a notable decline, ultimately closing around 21,500.
Concurrently, the Sensex concluded the session at 71,139.90, registering a decline of 801.67 points or 1.11 percent. Nifty, reflecting weakness, closed at 21,522.10, with a decrement of 215.50 points or 0.99 percent.
The broader market scenario indicated a mixed picture, with 1897 shares closing higher, 1333 experiencing a decline, and 68 maintaining their status quo.
This trend was not exclusive to large-cap stocks, as both small and medium stocks faced a downturn. The BSE Midcap index witnessed a 0.5 percent fall, while the smallcap index concluded the day with a flat performance.
Top Nifty losers on the day included Bajaj Finance, Titan Company, UltraTech Cement, NTPC, and Bajaj Finserv. On the other side, Tata Motors, BPCL, Grasim Industries, Eicher Motors, and Adani Enterprises emerged as the top gainers.
Sector-wise, realty and PSU banks were exceptions, with all other indices closing in the red. Notable sectors such as Capital Goods, FMCG, Pharma, and Power witnessed declines ranging from 0.5 to 1 percent.
Anticipating Market Moves on January 31:
As investors gear up for the trading session on January 31, insights from market experts shed light on potential market trajectories. Aditya Gaggar, Director of Progressive Shares, offered valuable perspectives on Nifty’s recent performance, noting its alignment with signals from the previous day.
Gaggar pointed out the formation of a dark cloud cover candlestick pattern, signaling a bearish outlook. The index encountered significant selling pressure at 21,750, resulting in an extended fall and ultimately closing at 21,522.10, down 215.50 points.
While the overall market faced headwinds, Gaggar highlighted the positive trend in PSU banking performance.
However, energy shares grappled with pressure attributed to profit-booking activities. Gaggar’s technical analysis introduced the notion that the majority of the decline could be attributed to the formation of the right shoulder of an inverted head and shoulders structure.
In terms of technical levels, Gaggar identified support for Nifty at 21,460, offering a potential floor for the index’s decline. Simultaneously, immediate resistance was noted at 21,680, signifying a level where the index could encounter hurdles in its upward movement.
Adding another layer to the analysis, Rupak Dey of LKP Securities emphasized the day’s volatility and the prevailing bearish trend. Dey pointed to the daily chart, indicating the formation of a black cloud—a bearish signal in the short term.
He identified support for Nifty at 21,500, emphasizing that a breach of this level could trigger further correction in the market. On the flip side, surpassing the 21,500 mark could potentially amplify positive momentum.
Comprehensive Technical Analysis:
Examining the technical indicators becomes crucial for a comprehensive understanding of market movements. Aditya Gaggar’s observation of the right shoulder formation in an inverted head and shoulders structure suggests a potential reversal pattern.
In technical analysis, the inverted head and shoulders pattern is considered a bullish reversal formation.
However, the presence of a right shoulder, as highlighted by Gaggar, introduces a nuanced perspective, potentially indicating a more complex market sentiment.
The support level at 21,460, as identified by Gaggar, aligns with Rupak Dey’s analysis, who also recognizes the significance of the 21,500 support level.
In technical terms, support levels often represent zones where buying interest may emerge, potentially acting as a floor for further declines. Investors and traders closely monitor these levels for potential entry or exit points.
The immediate resistance level at 21,680, identified by Gaggar, represents a hurdle that the market may need to overcome for a sustained upward move.
Resistance levels often indicate zones where selling interest might intensify, potentially causing a pause or reversal in an upward trend.
Expert Perspectives on Sectoral Performance:
Delving into sectoral dynamics is essential to gaining a holistic view of the market. The notable decline in sectors such as Capital Goods, FMCG, Pharma, and Power, ranging from 0.5 to 1 percent, underscores the breadth of the market downturn on January 30.
Investors should carefully assess the underlying factors contributing to the weakness in these sectors and monitor for potential shifts in sentiment.
Realty and PSU banks, emerging as exceptions with positive performances, present interesting dynamics within the market. Analyzing the reasons behind the resilience of these sectors can provide insights into the factors influencing investor sentiment.
Additionally, understanding the nuances of individual stocks within these sectors can guide investors in making informed decisions.
Market Sentiment and Volatility:
The heightened volatility witnessed on January 30 is indicative of uncertainty and rapid shifts in market sentiment. Volatility, often measured by indicators such as the VIX (Volatility Index), reflects the magnitude of price fluctuations.
Traders and investors should closely monitor volatility levels, as extreme volatility can signal periods of heightened risk and potential opportunities.
The presence of a bearish trend, as highlighted by Rupak Dey’s observation of the black cloud on the daily chart, adds another layer to the market sentiment.
Bearish signals, particularly on short-term charts, may influence traders to adopt a cautious approach and implement risk management strategies.
Final Thoughts:
In conclusion, the stock market’s performance on January 30, characterized by a significant decline in Nifty and Sensex, prompts a detailed analysis of market dynamics.
Expert opinions from Aditya Gaggar and Rupak Dey offer valuable insights into the technical aspects of Nifty’s movements, potential support and resistance levels, and the formation of reversal patterns.
As investors look ahead to January 31, navigating the market requires a nuanced understanding of sectoral performances, volatility levels, and overall market sentiment.
The interplay of various factors, including global economic trends, geopolitical developments, and corporate earnings, further adds complexity to the market landscape.
In this ever-changing environment, staying informed, conducting thorough research, and adopting a strategic approach are crucial for investors and traders seeking to navigate the uncertainties and capitalize on potential opportunities in the stock market.
As the market continues to evolve, adaptability and a disciplined approach remain key pillars for success in the dynamic world of stock trading and investment.