Share Market Today: Stock Market Closed Flat Predicting the Moves for November 08
Share Market Today
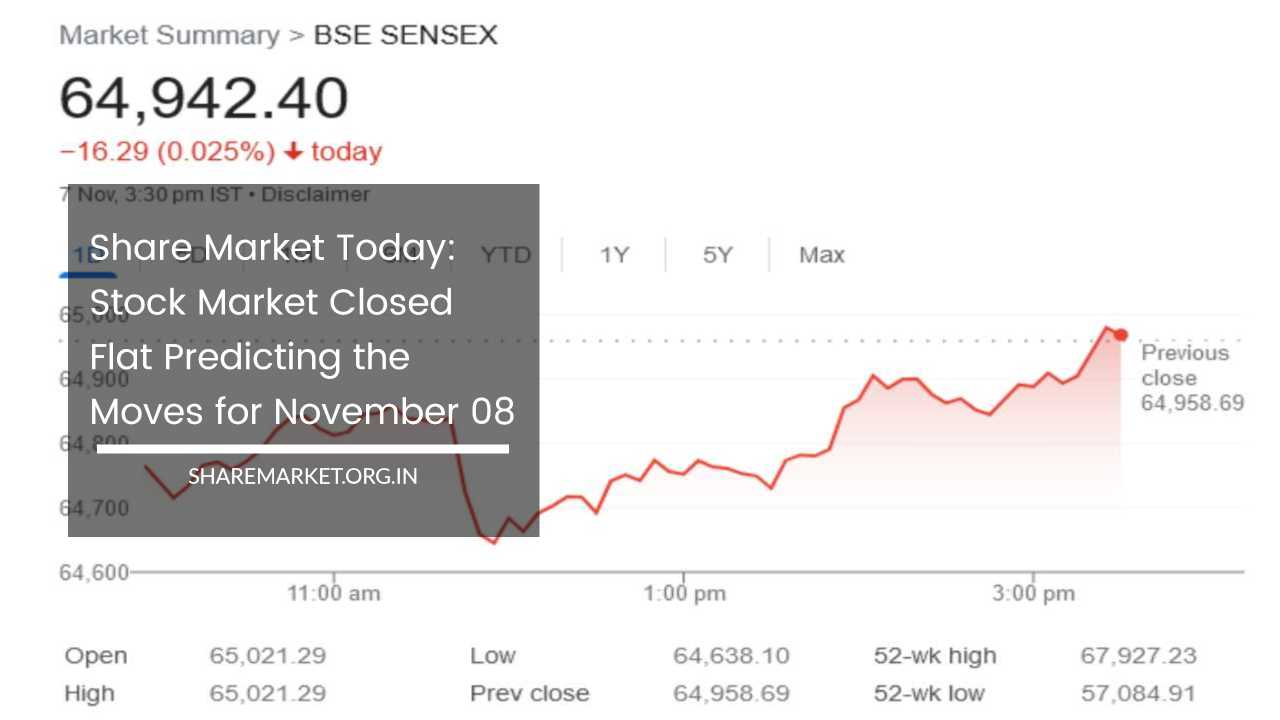
The Indian stock market experienced a rather subdued trading session on November 07, 2023. The market closed flat, characterized by significant intraday volatility. At the end of the trading day, the Sensex, India’s benchmark stock index, concluded at 64,942.40.
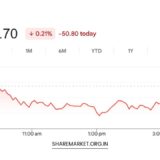
This represented a minor decline of 16.29 points or 0.03 percent. In a similar vein, the Nifty, another key index, closed at 19,406.70, showing a decrease of 5.10 points or 0.03 percent.
The day’s trading activity saw around 1,878 stocks recording gains, 1,616 stocks declining, and no change observed in 146 stocks. What was particularly noteworthy on this day was the outperformance of small and medium-cap stocks over their larger counterparts.
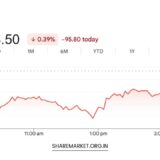
The BSE Midcap Index ended the session with a gain of 0.5 percent, while the Smallcap Index recorded a 0.4 percent increase.
Taking a closer look at the performance of individual stocks within the Nifty index, we observed Hero MotoCorp, Coal India, Bajaj Finance, JSW Steel, and Divis Labs as the top losers.
In contrast, Sun Pharma, BPCL, NTPC, Axis Bank, and Dr. Reddy’s Labs were among the top gainers of the Nifty index.
Furthermore, sectoral indices provided insights into the day’s sector-wise performance, with the healthcare and oil and gas sectors showing gains of 1 percent. On the flip side, the realty sector experienced a decline of 1 percent.
Expert Opinions and Predictions for November 08, 2023:
As investors and traders gear up for the trading day on November 08, several market experts and analysts have shared their perspectives on the market’s potential trajectory.
Aditya Gaggar, the Director at Progressive Shares, provided insights into the day’s performance and shared his analysis. He noted that the market displayed a range-bound movement during the trading session on November 07.
The Nifty index, which closed at 19,406.70, registered a slight decline of 5.05 points by the session’s end. Gaggar emphasized that the pharmaceutical sector stood out as the best-performing sector of the day, recording a gain of 1.32 percent. In contrast, the realty sector experienced pressure due to profit booking.
Gaggar pointed out an important technical aspect by highlighting the formation of an inside bar candlestick pattern on the daily chart.
This pattern is generally regarded as a sign of consolidation or market indecision. He further elaborated on potential price levels to watch. If the Nifty index manages to achieve a strong closing above 19,420, it could open the doors for a move towards 19,560.
On the downside, there is visible support for the Nifty at 19,350, which could act as a significant level to monitor.
Another critical development that Aditya Gaggar mentioned was in the Bank Nifty, which is closely followed by market participants.
The Bank Nifty displayed strength by achieving a strong closing above the 21-day moving average (DMA), accompanied by a break above the major hurdle at 43,600. This accomplishment signaled continued bullish sentiment in the index.
The market expert opined that there is potential for Bank Nifty to move towards the 44,000 mark. On the downside, a strong support level is identified at 43,300, offering a degree of stability.
Jatin Gedia, a respected analyst from Sharekhan, shared his insights on Nifty’s performance. Gedia noted that Nifty opened with a flat trend on the trading day but experienced intraday declines. However, buying interest was seen returning during the decline, particularly near the support zone in the range of 19,330 to 19,300.
A notable feature of the day was a sharp rally in Nifty during the latter part of the trading session, which helped it recover from earlier losses.
As a result, Nifty concluded the session with a marginal decline of 5 points. Gedia also pointed out the technical indicator’s behavior, mentioning that the Hourly Momentum Indicator exhibited a positive crossover from the balance line. This is interpreted as an early sign of a new bullish trend phase in Nifty.
Regarding price levels to watch for Nifty, Jatin Gedia explained that Nifty is currently approaching a significant resistance zone in the range of 19,450 to 19,500. Should Nifty manage to surpass this hurdle, it could embark on another leg of the upward move, potentially reaching 19,690.
On the downside, Nifty has identified support zones at 19,300 and 19,270, offering potential levels to monitor in case of a reversal.
In the context of the Bank Nifty, Gedia noted that the index displayed a rapid recovery from intraday declines and closed the trading session at the day’s high. The zone of 43,300 to 43,200 served as a robust support area.
The analyst predicted that Bank Nifty could make its way to 44,000 soon, given the alignment of the momentum setup with the price action, which suggests the possibility of further upward movement.
Technical Analysis and Price Levels:
To delve deeper into the technical aspects of the market, let’s explore the price levels, patterns, and indicators that experts like Aditya Gaggar and Jatin Gedia have highlighted.
Nifty’s formation of an inside bar candlestick pattern on the daily chart is a critical point of analysis. This pattern typically signifies a period of consolidation or indecision in the market.
For traders and investors, it serves as a visual representation of the equilibrium between buying and selling forces at a particular price level. In this case, the inside bar candlestick pattern implies that market participants are waiting for a catalyst or a clear signal to determine the next significant price movement.
The support and resistance levels are essential references for traders. The support level at 19,350 for the Nifty suggests that this price point has acted as a stable foundation in the past, where buying interest has historically emerged.
Conversely, the resistance level at 19,420 indicates that this price point has posed challenges for the Nifty’s upward movement. Achieving a strong closing above this resistance level is considered a bullish sign.
In the case of the Bank Nifty, the 21-day moving average (DMA) and the major hurdle at 43,600 are noteworthy technical factors.
The fact that Bank Nifty achieved a strong closing above the 21-DMA indicates that the index is on solid footing.
Additionally, surpassing the significant hurdle at 43,600 underscores the index’s resilience and bullish sentiment. This development aligns with the price action, where the Bank Nifty is likely to continue its upward movement.
Sectoral Analysis:
The sectoral performance in the market is a key area of focus for traders and investors. The performance of different sectors can provide insights into market trends and investor sentiment.
On November 07, 2023, the pharmaceutical sector, often referred to as the healthcare sector, emerged as the best-performing sector of the day.
It recorded a substantial gain of 1.32 percent. This performance may be attributed to various factors, including positive developments in specific pharmaceutical companies, favorable news related to the healthcare sector, or investor confidence in this particular industry.
In contrast, the realty sector experienced a decline of 1 percent. This decline could be a result of profit booking, wherein investors who had previously seen gains in realty stocks decided to sell and lock in their profits.
Market sentiment, economic conditions, and government policies can all influence the performance of the realty sector.
Summary and Conclusion:
In summary, the Indian stock market concluded November 07, 2023, with a flat close amid substantial intraday volatility. Key indices, including the Sensex and Nifty, displayed a modest decline by the end of the trading session.
The market witnessed notable outperformance of small and medium-cap stocks over their larger counterparts, as indicated by the gains in the BSE Midcap and Smallcap indices.
As market participants prepare for November 08, several market experts provided their insights and predictions. Aditya Gaggar emphasized the formation of an inside bar candlestick pattern on the daily chart, which indicates market consolidation or indecision.
He also highlighted key support and resistance levels for the Nifty and the strong performance of the pharmaceutical sector.
Jatin Gedia, from Sharekhan, offered a technical perspective on Nifty’s performance, mentioning a positive crossover in the Hourly Momentum Indicator and potential resistance and support levels. Gedia also commented on the Bank Nifty’s strong performance and predicted further upward movement.
Technical analysis, including the inside bar candlestick pattern, support and resistance levels, and moving averages, offers valuable information for traders.
Additionally, the performance of different sectors, such as the pharmaceutical and realty sectors, provides insights into market trends and investor sentiment.
Ultimately, the Indian stock market remains dynamic and responsive to a range of factors, including economic indicators, corporate earnings, global events, and investor sentiment.
As traders and investors navigate the markets, they must stay informed about these factors and utilize technical analysis to make well-informed decisions.