Sensex Gain 1,533 Points, Nifty at 22,997; Tomorrow Nifty Prediction
Detailed Indian Equity Market Outlook: Analyzing the October 15 Rally and Trajectory for October 16
Executive Summary & Index Performance
The Indian equity markets staged a remarkable recovery on October 15, defying significant weakness across global markets. Driven by aggressive buying in technology heavyweights, large-cap private banks, and defensive plays, the benchmark indices erased recent losses and closed sharply higher near key technical handles.
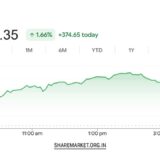
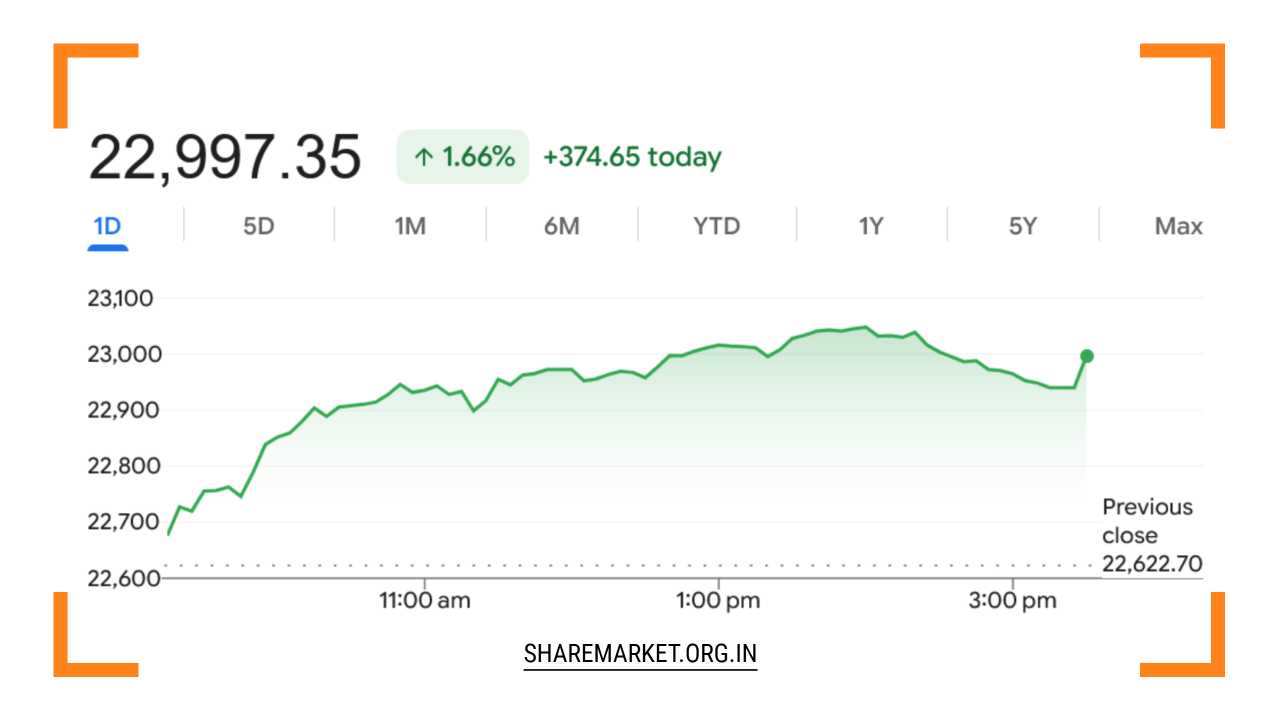
At the closing bell, the BSE Sensex soared by 1,533.72 points, or 2.11 percent, to finish at 74,315.61. Simultaneously, the NSE Nifty 50 surged 374.65 points, or 1.66 percent, settling at 22,997.35—just short of the psychological 23,000 mark after briefly touching higher levels intraday.
Despite the impressive gains in the main benchmark indices, market breadth revealed a notable underlying divergence across the broader market spectrum:
-
Advancing Stocks: 1,592
-
Declining Stocks: 2,606
-
Unchanged Stocks: 162
This negative advance-decline ratio highlights that while large-cap blue-chip stocks propelled the benchmark indices upward, the broader market experienced widespread selling pressure, indicating that the rally was highly concentrated rather than broad-based.
Sectoral Trends & Key Stock Movers
The trading session showcased clear sector rotation and divergent investor sentiment across various market segments:
Leading Sectors and Top Gainers
-
Outperforming Sectors: Buying momentum was prominently concentrated in auto, information technology (IT), infrastructure, oil and gas, private banking, and real estate. These sectoral indices recorded steady gains ranging between 1.0 percent and 1.8 percent.
-
Top Nifty Gainers: The rally in the benchmark index was anchored by heavyweights such as Tech Mahindra, ICICI Bank, Bharti Airtel, HCL Technologies, and Reliance Industries. Tech Mahindra and other IT leaders benefited significantly from strong quarterly earnings and positive sector-specific outlooks.
Laggards and Broader Market Underperformance
-
Underperforming Sectors: Media and Public Sector Undertaking (PSU) bank indices faced substantial profit-booking, falling by more than 1 percent.
-
Top Nifty Losers: Among the individual Nifty constituents, Nestle India, Trent, Adani Enterprises, Shriram Finance, and Larsen & Toubro (L&T) emerged as the top losers of the session.
-
Small & Mid-Cap Divergence: The broader market failed to mirror the optimism of the front-line indices. The Nifty Midcap index slipped 0.5 percent, while the Nifty Smallcap index suffered a steep correction, falling 1.3 percent. This decline in secondary-tier stocks signals ongoing caution among retail and high-net-worth investors.
Macro Drivers Behind India’s Global Outperformance
The sharp rally in Indian equities occurred against a backdrop of severe global market volatility, particularly across Asian markets which plunged between 1 percent and 8 percent. Heavy sell-offs in global technology and artificial intelligence (AI)-related stocks were triggered by concerns over the high infrastructure costs of AI and renewed fears of rising inflation in the United States.
However, several domestic and macroeconomic tailwinds allowed the Indian market to decouple from global headwinds:
-
Capital Realignment to Defensive Blue-Chips: The global unwind in expensive AI and tech stocks prompted institutional flows toward large-cap Indian IT firms, private financial institutions, and defensive counters, which offered safer relative value.
-
Supportive Domestic Factors: A stable Indian Rupee—supported by timely measures from the Reserve Bank of India (RBI)—along with easing international crude oil prices and improving domestic bond yields strengthened overall market confidence.
-
Taxation & Sentiment: Market sentiment was further bolstered by growing expectations and discussions surrounding a potential reconsideration of equity taxation structures, enhancing institutional risk appetite.
Technical Structure & Key Indicators
From a technical perspective, the Nifty’s dynamic rebound has altered the short-term structure while leaving broader medium-term trends somewhat cautious.
Bullish Short-Term Signals
-
20-DMA Reclamation: The Nifty successfully bounced off its recent lows and reclaimed its 20-day Simple Moving Average (DMA) on the daily chart, pointing to a strong short-term pullback.
-
Momentum Crossover: The Relative Strength Index (RSI) exhibited a bullish crossover with positive divergence, rising steadily from lower territory toward the 40 mark. Concurrently, the Moving Average Convergence Divergence (MACD) highlighted a noticeable reduction in selling pressure.
Cautionary Medium-Term Signals
-
Moving Average Resistance: Despite the daily recovery, the Nifty continues to trade below its critical 50-day and 200-day Moving Averages, as well as its 20-day and 50-day Exponential Moving Averages (EMAs).
-
Relief Rally Framework: Until the index convincingly reclaims its 50 DMA, technical structures suggest treating the current move primarily as a relief rally within a wider consolidation phase. The formation of daily candles with top and bottom wicks over recent sessions reflects underlying market indecision and volatility.
Outlook & Strategic Levels for October 16th
As the market prepares for the October 16th session, trading is expected to remain range-bound with heightened stock-specific volatility. Near-term directional clarity will largely depend on second-quarter (Q2) corporate earnings performance, margin improvements, broader market participation, and the trajectory of Foreign Institutional Investor (FII) flows.
Furthermore, investors will closely monitor geopolitical developments (including US-Iran tensions in West Asia), global inflation trends, crude oil price fluctuations, and currency movements.
Critical Nifty Levels to Watch for October 16:
-
Upside Resistance Targets:
-
Immediate Resistance: 22,770 – 22,800. A sustained hold above this region opens the door for a continuation of the pullback toward 22,950.
-
Major Overhead Resistance: 23,180 – 23,200. A decisive move above 23,000 could test the 38.2% Fibonacci retracement level near 23,180, with key resistance capped at 23,200.
-
-
Downside Support Zones:
-
Immediate Support: 22,800.
-
Crucial Support Zone: 22,500 – 22,480. If the index breaks below this floor, it could signal renewed weakness, exposing the index to lower targets around 22,330.
-
Trading Strategy Approach
Given the lack of uniform participation across mid- and small-cap stocks and ongoing selling by foreign investors, a cautious, level-based approach remains advisable until a clear technical breakout above key moving averages is established.